
Creating an Overlay Map with GMT
In our previous GMT examples we used a single command to create a simple globe and create an annotated map. In this example we will create a base map and then use the overlay feature of GMT to plot the location of volcanoes throughout the world.
The first step is to create the base map using pscoast:
pscoast -JN0/26 -R-180/180/-90/90 -W -G220/220/220 -S0/192/255 \

  -N1 -B60g10 :."World Volcanoes": --PAPER_MEDIA=archA -K > world_volcanoes.eps
Here is a brief summary of the arguments used to create the base map:
(Many of these parameters are discussed in greater detail in the previous GMT posts—see links above.).
- -JN0/26
- Use the Robinson projection centered at 0 degrees longitude. The map will be 26 cm wide
- -R-180/180/-90/90
- The region of interest is set to the entire globe
- -W
- Draw coastlines
- -G220/220/220
- Fill the dry areas (i.e. land) with RGB color 220,220,220
- -S0/192/255
- Fill wet areas with RGB color 0,192,255
- -N1
- Draw national political boundaries
- -B60g10 :.”World Volcanoes”:
- Place annotation at 60 degree intervals on grid lines 10 degrees apart. Title the map “World Volcanoes”
- –PAPER_MEDIA=archA
- Set the paper size to archA
- -K
- More PostScript code will be appended later
The -K allows us to create an overlay by issuing additional commands.
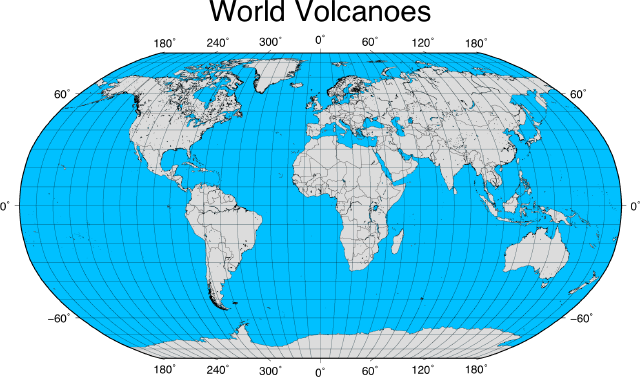
If we were to run pscoast without -K it would give us a nice base map:
Now that we have the base map command complete (don’t forget the -K) we can add our overlay. For this we use a text file containing the locations of the volcanoes. The file format is simply longitude, latitude:
7.25,27.08

131.6,34.5

-67.62,-23.3

-90.876,14.501

...
The file doesn’t contain any attribute information about the volcanoes, just the location.
To create the overlay, we use the psxy command:
psxy volcano_xy.txt -JN -O -R -Sc0.15c -G255/0/0 >> world_volcanoes.eps
The arguments are:
- volcano_xy.txt
- The name of the text file containing the locations
- -JN
- The map projection (Robinson). No additional parameters are required
- -R
- The region of interest. With no parameters it will use those specified in our pscoast command
- -Sc0.15c
- Set the symbol to a circle (c) with a size of 0.15 cm
- -G255/0/0
- Set the color for the symbol to RGB 255,0,0 (red)
- -O
- The important argument—overlay on the previous map
Notice that we redirect the output using >> to append to our world_volcanoes.eps file.
This gives us the completed map:
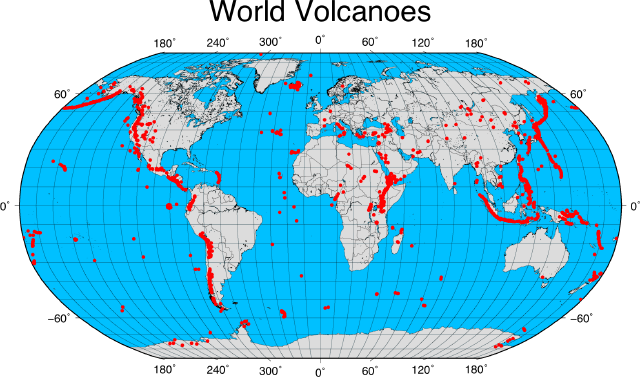
With psxy you can also draw line and polygons. Check out the GMT documentation for more details and be sure to see the previous blog posts on creating a simple globe and creating an annotated map.
The volcano locations used in this post are available here.
 January 16, 2009
·
January 16, 2009
·  admin ·
  No Comments
 Tags: gmt · Posted in: GMT


