
The Volcano and the Buffer
Here in Alaska we have over 130 volcanoes with more than 50 being active in about the last 250 years. Presently Mt. Redoubt is in an eruptive phase and has been since March 22. Ash from the volcano has fallen in a number of communities and areas throughout the state. A couple of weeks or so ago the reports from the Alaska Volcano Observatory indicated the ash was falling within 30 miles of the volcano. I decided to do a quick analysis to see what areas might be affected.
This is an example of simple analysis with GIS. We just get the location of the volcano and create a 30 mile buffer and then visually determine the affected areas. To do this we need data for towns and the location of the volcano. We could use a volcano layer if we had one, but in this case I’m going to use a simple method to create a point shapefile from text data.
The AVO website indicates that Mt. Redoubt is located at
Latitude: 60.4852° N
Longitude: 152.7438° W
To create a shapefile we start with a plain text file named redoubt.csv containing:
Lat,Lon,Name
60.4852,-152.7438,"Mt. Redoubt"
Next we use the VRT facility of GDAL/OGR to create a virtual data set from the CSV file and save it in redoubt.vrt:
<OGRVRTDataSource>
    <OGRVRTLayer name="redoubt">
        <SrcDataSource>redoubt.csv</SrcDataSource>
        <GeometryType>wkbPoint</GeometryType>
        <LayerSRS>WGS84</LayerSRS>
        <GeometryField encoding="PointFromColumns" x="Lon" y="Lat"/>
    </OGRVRTLayer>
</OGRVRTDataSource>
Our towns and base data are in an Albers Equal Area projection. To use the volcano location we need to transform it from WGS84 (as specified in the VRT file) to the Albers projection. There are a number of ways to specify the output projection—in this case we will look it up on the Spatial Reference website and use the proj4 format:
+proj=aea +lat_1=55 +lat_2=65 +lat_0=50 +lon_0=-154 +x_0=0 +y_0=0
+ellps=GRS80 +datum=NAD83 +units=m +no_defs
To create the shapefile, we use ogr2ogr, transforming along the way:
ogr2ogr -t_srs "+proj=aea +lat_1=55 +lat_2=65 +lat_0=50 \
+lon_0=-154 +x_0=0 +y_0=0 +ellps=GRS80 +datum=NAD83 \
+units=m +no_defs" redoubt.shp redoubt.vrt
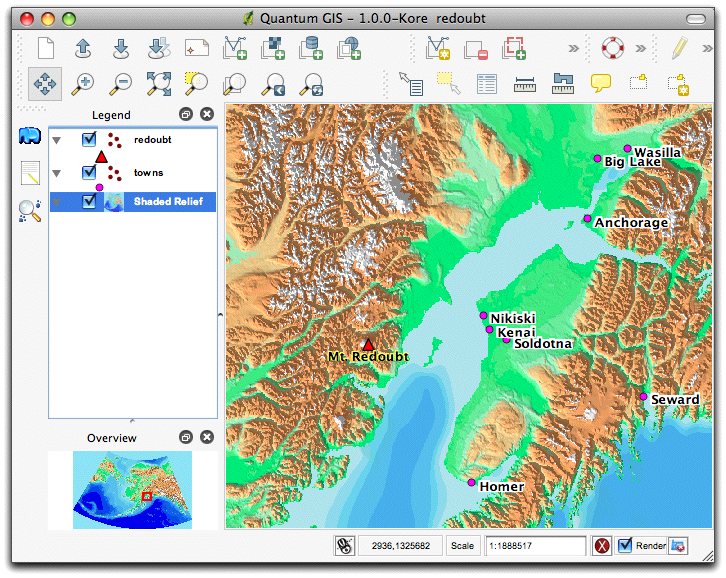
Now we are ready to create the buffer. Starting QGIS and loading our base data and the towns, as well as the newly created volcano shapefile gives us this:
Using the fTools plugin we choose Buffer from the Geoprocessing Tools menu and set the parameters:
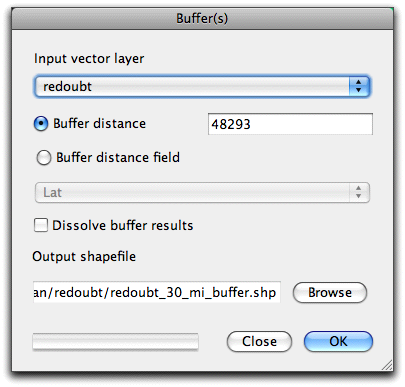
Note that we specified the buffer size in meters since our data is in meters not feet (30 miles ~= 48293 meters).
After the buffer is created and added to the map, a bit of symbolization tweaking to make it transparent gives us:
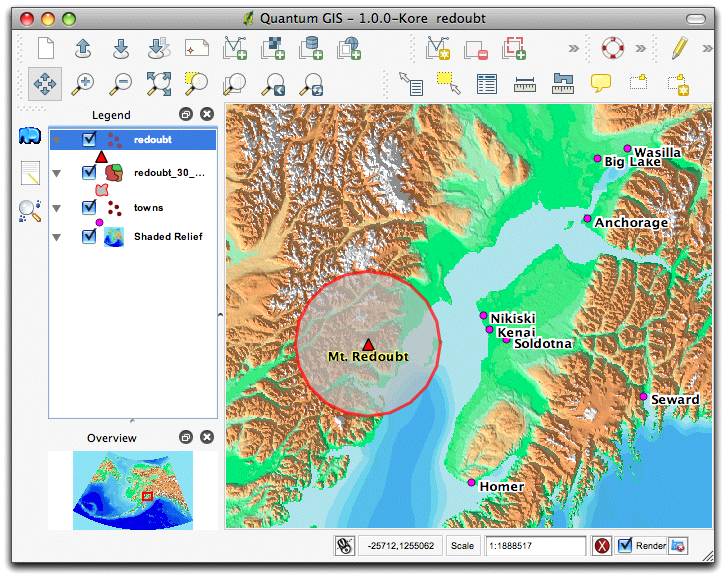
Looking at the resulting buffer we can see that no major communities were in the potential ash fallout area.
This simple example illustrates using an OGR command line utility to create some data needed for our analysis using QGIS and the fTools plugin. It’s worth taking a look at fTools—it provides a nice selection of tools for working with your spatial data within QGIS.
In case you are wondering, Mt. Redoubt seems to be taking it easy and just puffing along as of late:
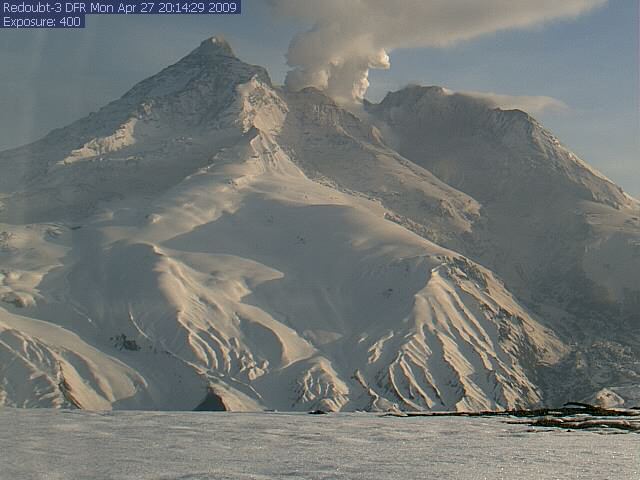
(Image courtesy of AVO)
 April 27, 2009
·
April 27, 2009
·  admin ·
  No Comments
 Tags: gdal, qgis, vrt · Posted in: GDAL, QGIS


